Read Sparkplug B metrics
Enable Sparkplug decoding, inspect named metrics and recover missing birth information.
Before you start
Connect to a broker carrying Sparkplug B traffic. Your subscription must include the relevant spBv1.0/ topics, for example spBv1.0/#. The screenshots use one test edge node and two devices. Request a rebirth only on a node you are authorised to command.
1. Enable Sparkplug decoding
Open the connection name menu and choose Edit connection…. Disconnect if needed, turn on Automatically encode/decode Sparkplug messages. Click Connect, then Save.
Sparkplug decoding is built in. You do not need to import a .proto file for this workflow.
2. Open the Sparkplug view
Once Sparkplug traffic arrives, click Sparkplug beside List and Graph. Expand the group and edge node to inspect its devices and metrics.
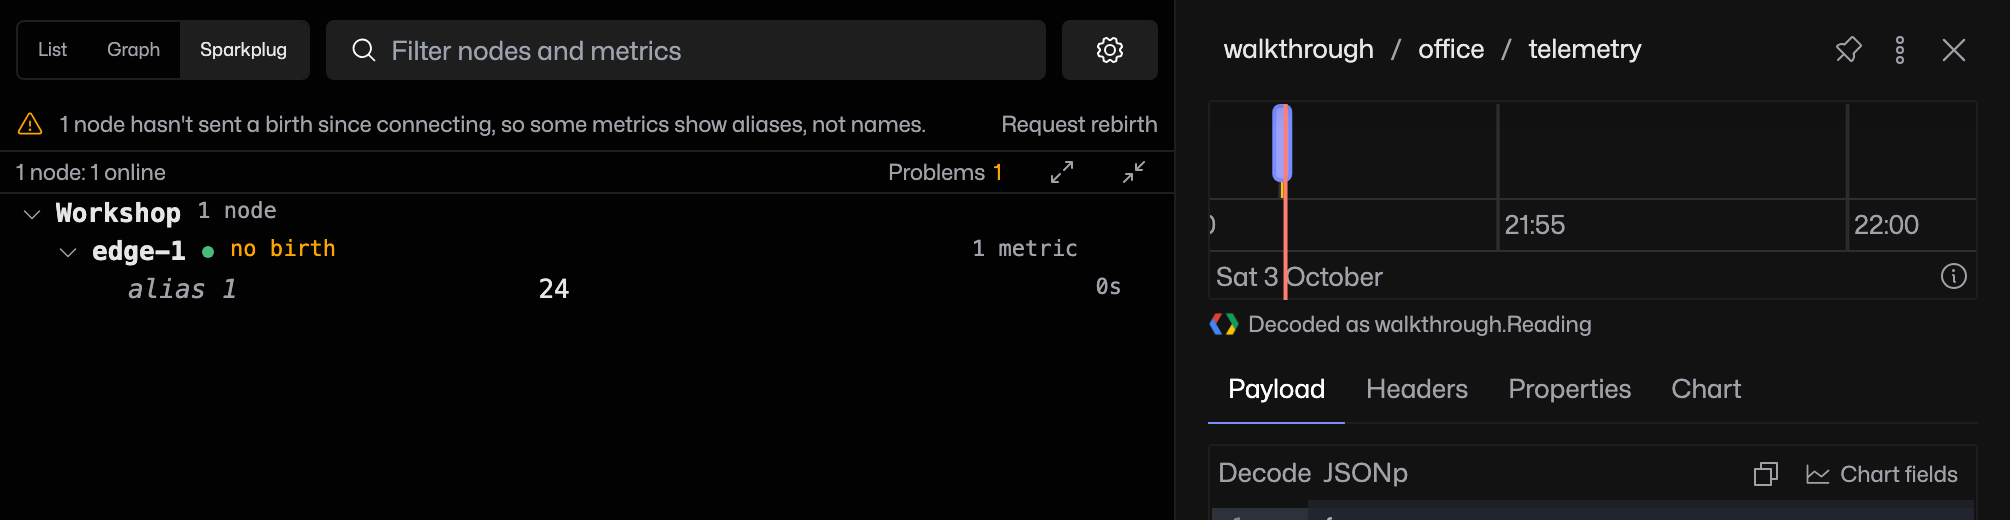
If MQTT Viewer joined after the birth messages, incoming data may contain aliases without names. The view identifies nodes that need birth information.
3. Recover names after a late join
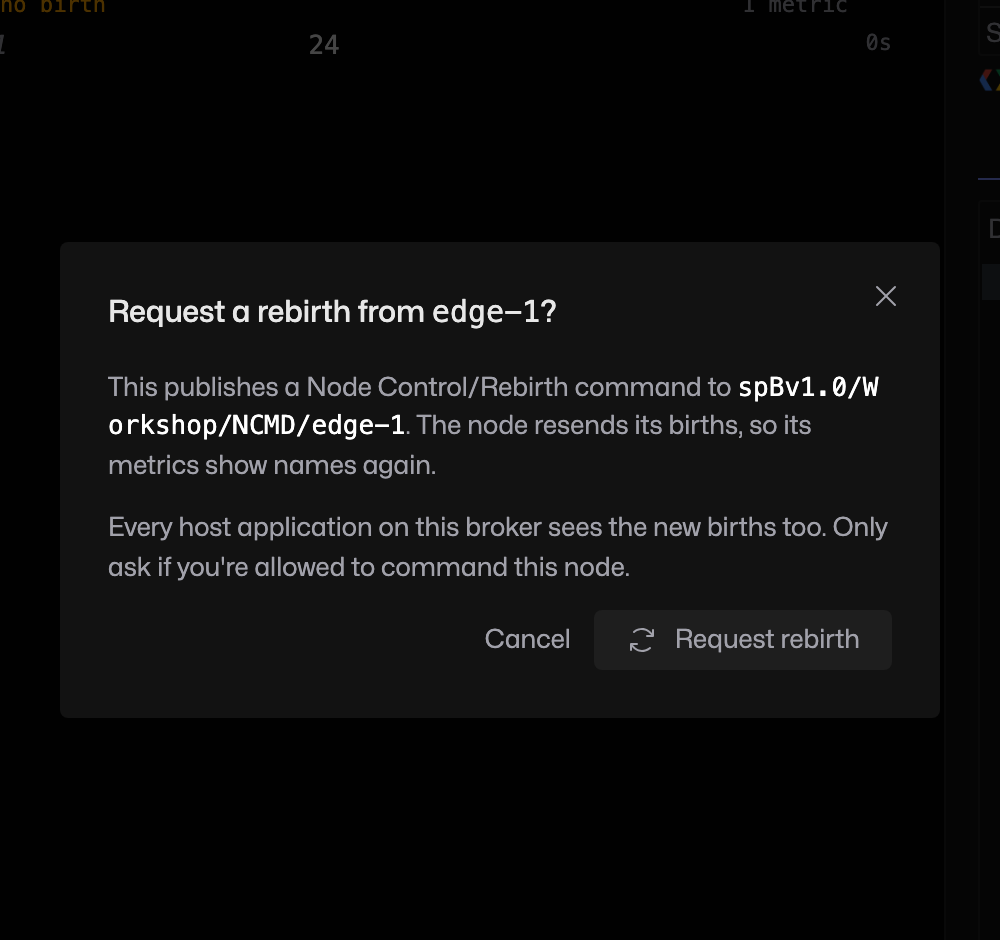
Click Request rebirth. Check the edge node and command topic in the confirmation, then click Request rebirth again. This sends a Node Control/Rebirth command to the edge node; the node must respond with its births.
4. Check the named metrics
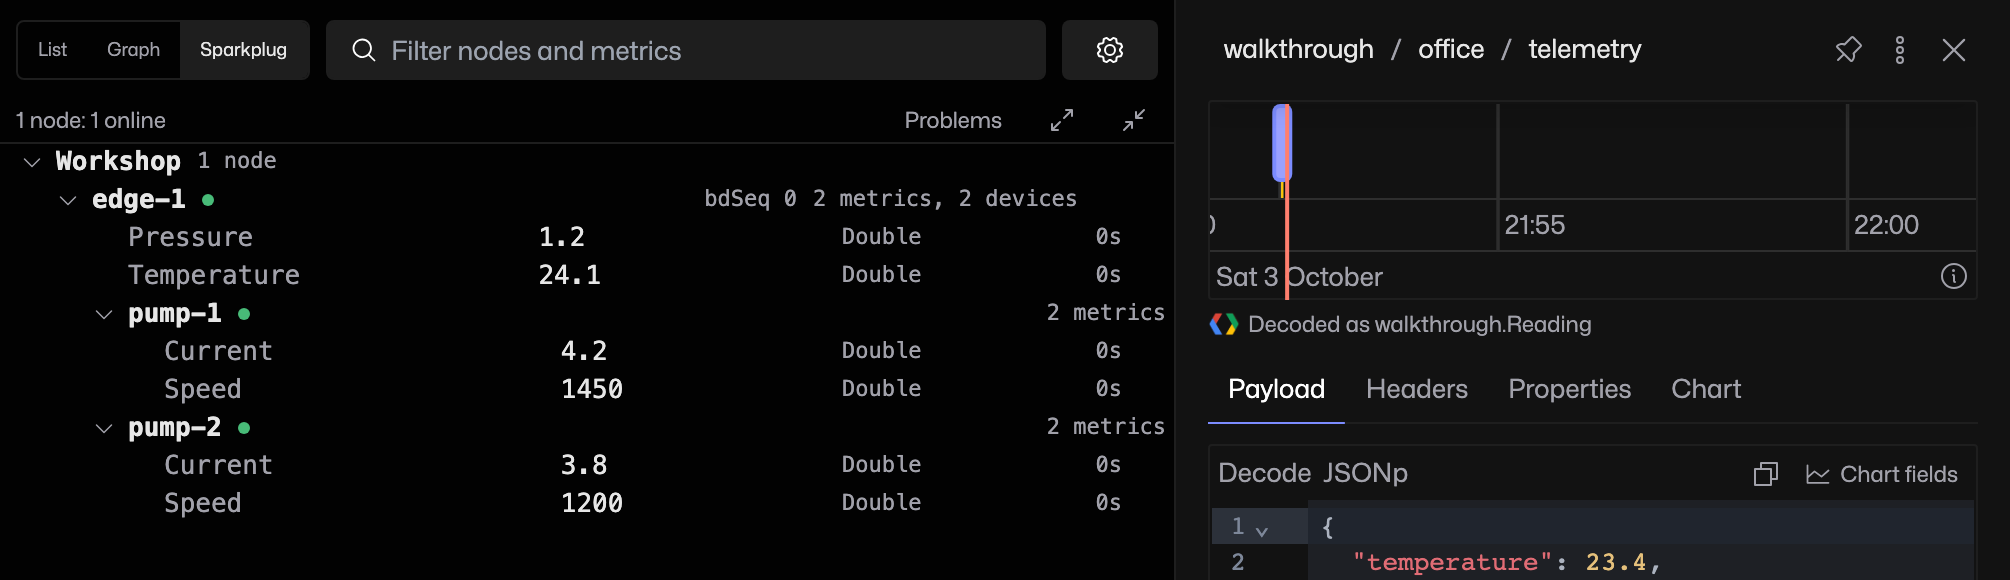
After the node responds, the tree should show metric names and values. Here edge-1 has Temperature and Pressure, with two pump devices below it. A later alias-only update changes Temperature to 24.1.
If names do not return
Check that the edge node is online, your broker allows the command and your subscription includes its birth topics. A successful request only confirms the command was sent; the node still has to respond. Check Client logs if the connection or subscription fails.