Mosquitto monitoring and MQTT broker status
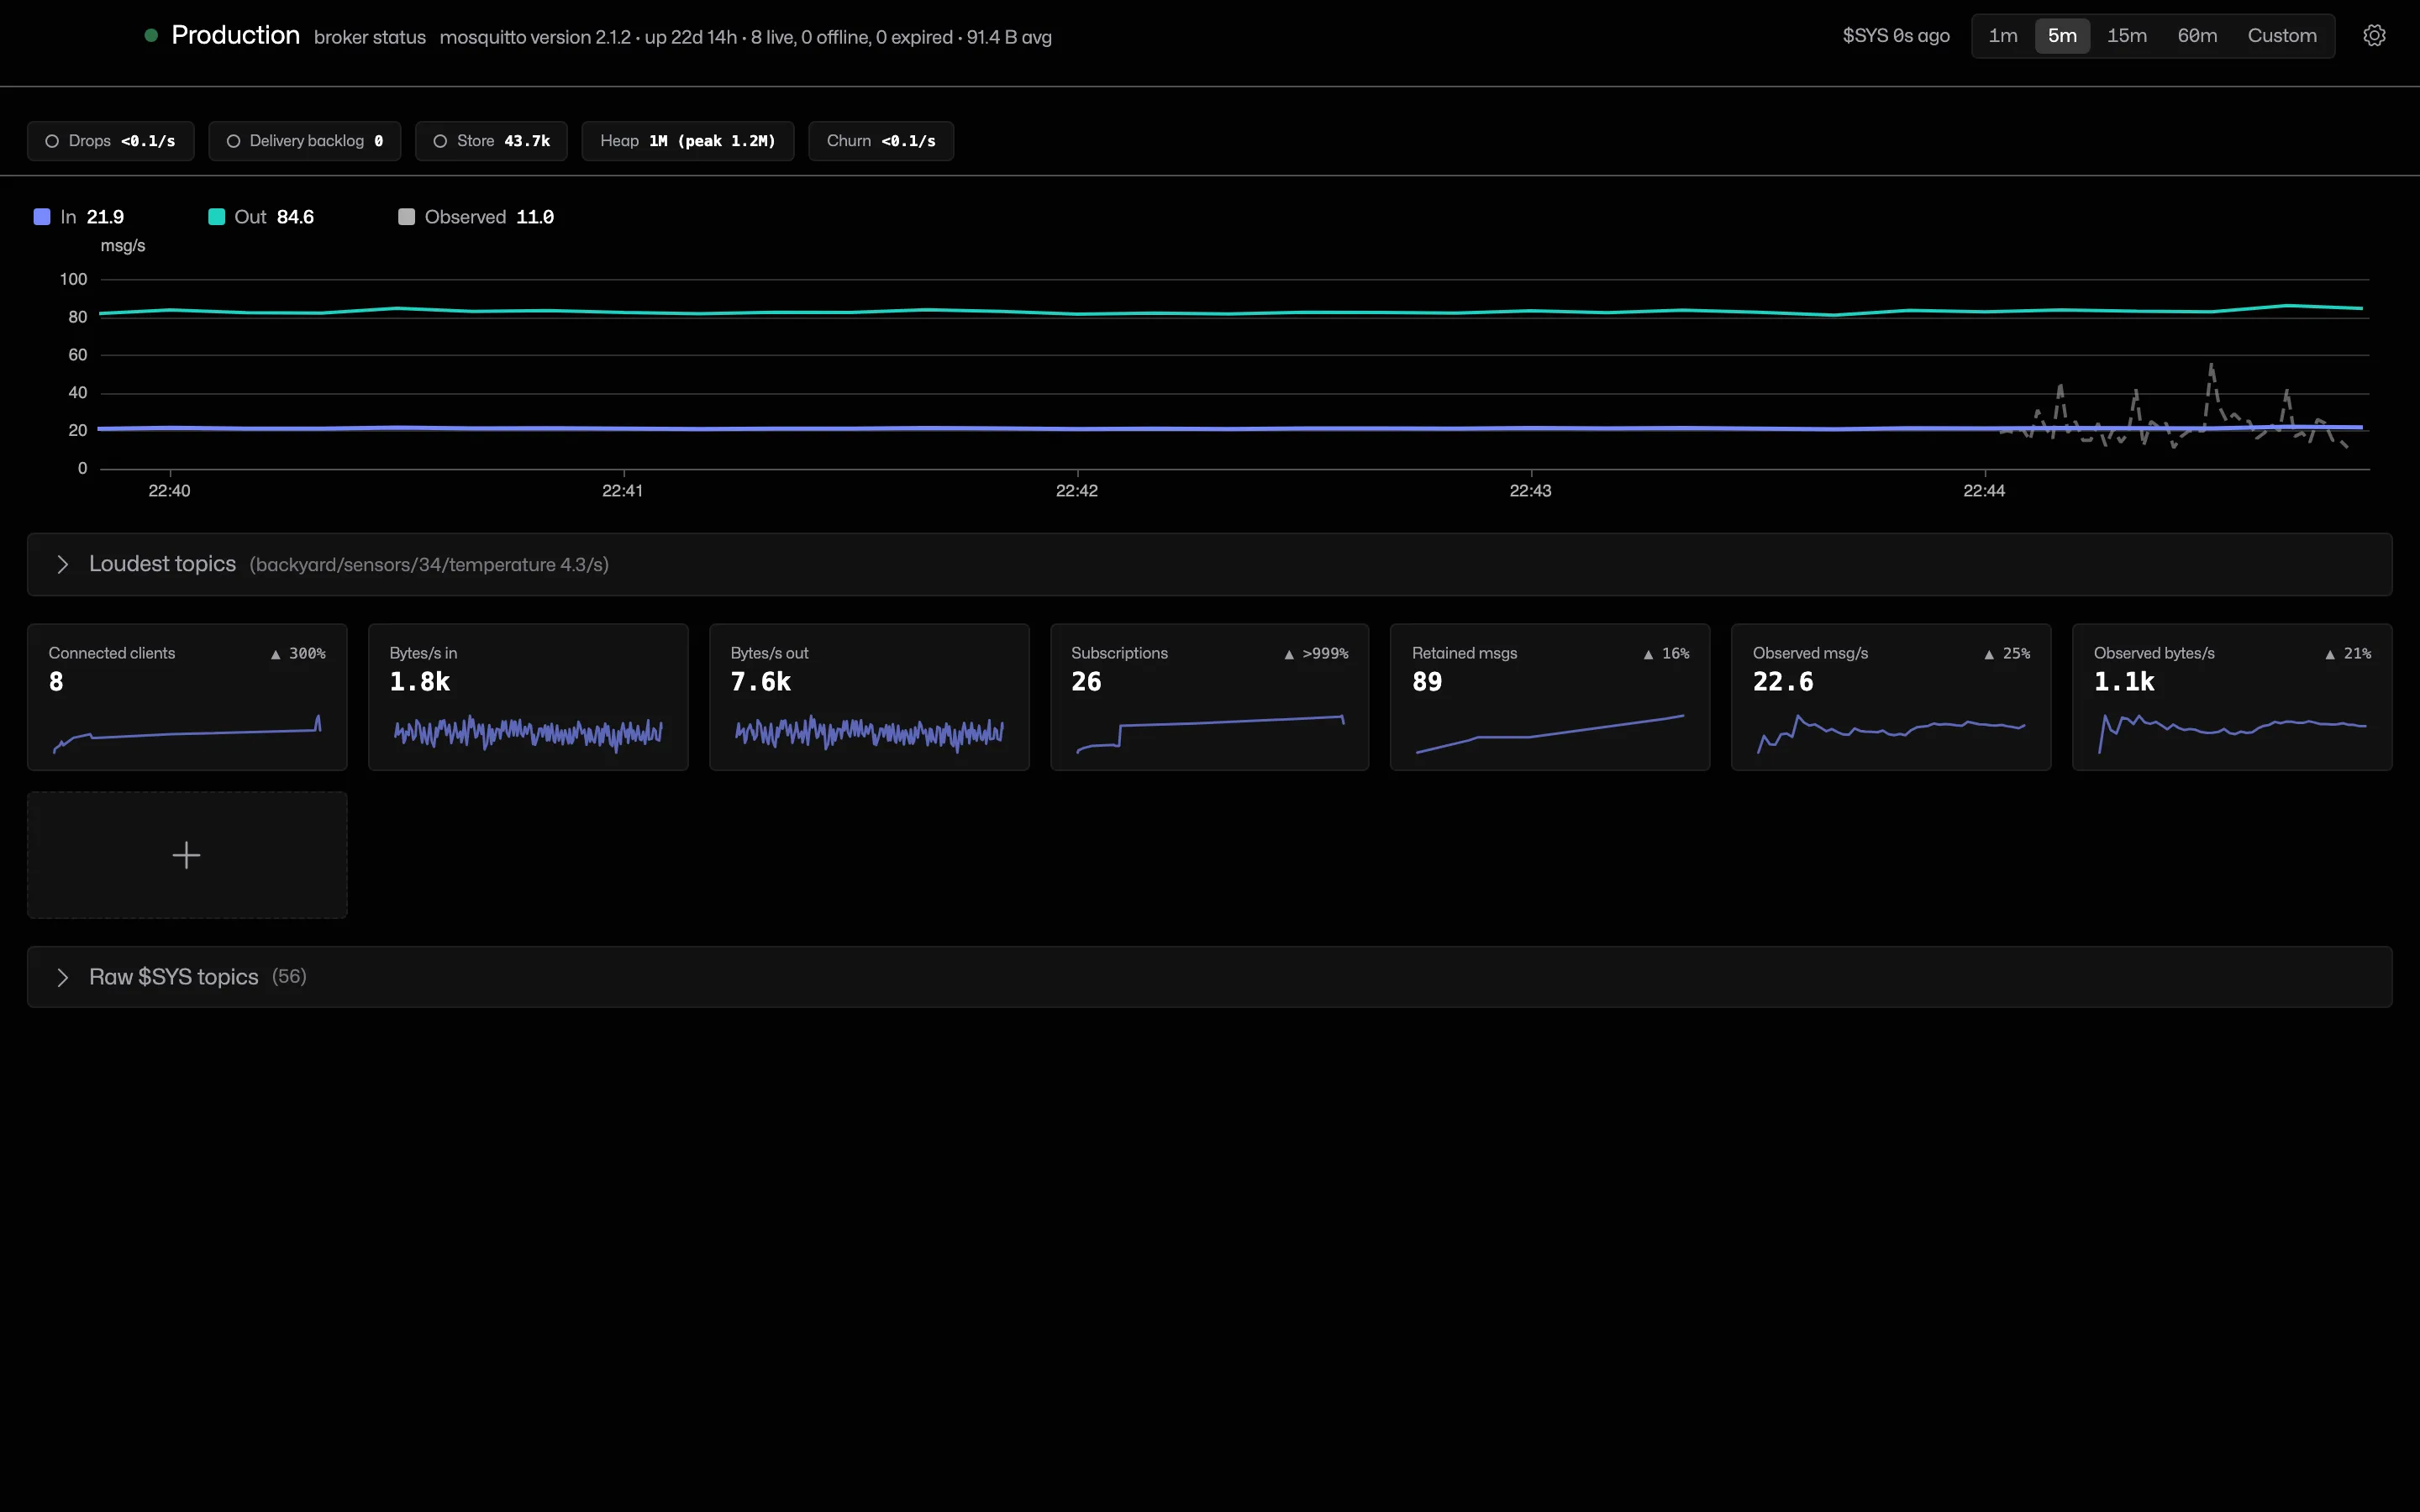
The status page turns a broker's $SYS topics into tiles with trend lines, health warnings and the loudest topics. Brokers that publish nothing still get client-side rates.
Try it in MQTT Viewer
Health warnings
Chips along the top report dropped messages, delivery backlog, store size, heap and client churn. Drops, backlog and store are coloured by trend rather than absolute value. A chip appears once the broker publishes that metric.
Traffic chart and loudest topics
The chart plots the broker's messages in and out per second next to the rate this client sees, over 1, 5, 15 or 60 minutes, or a custom interval.
Loudest topics ranks subscribed topics by message rate. It is computed on the client, so it works against any broker.
Supported brokers and custom tiles
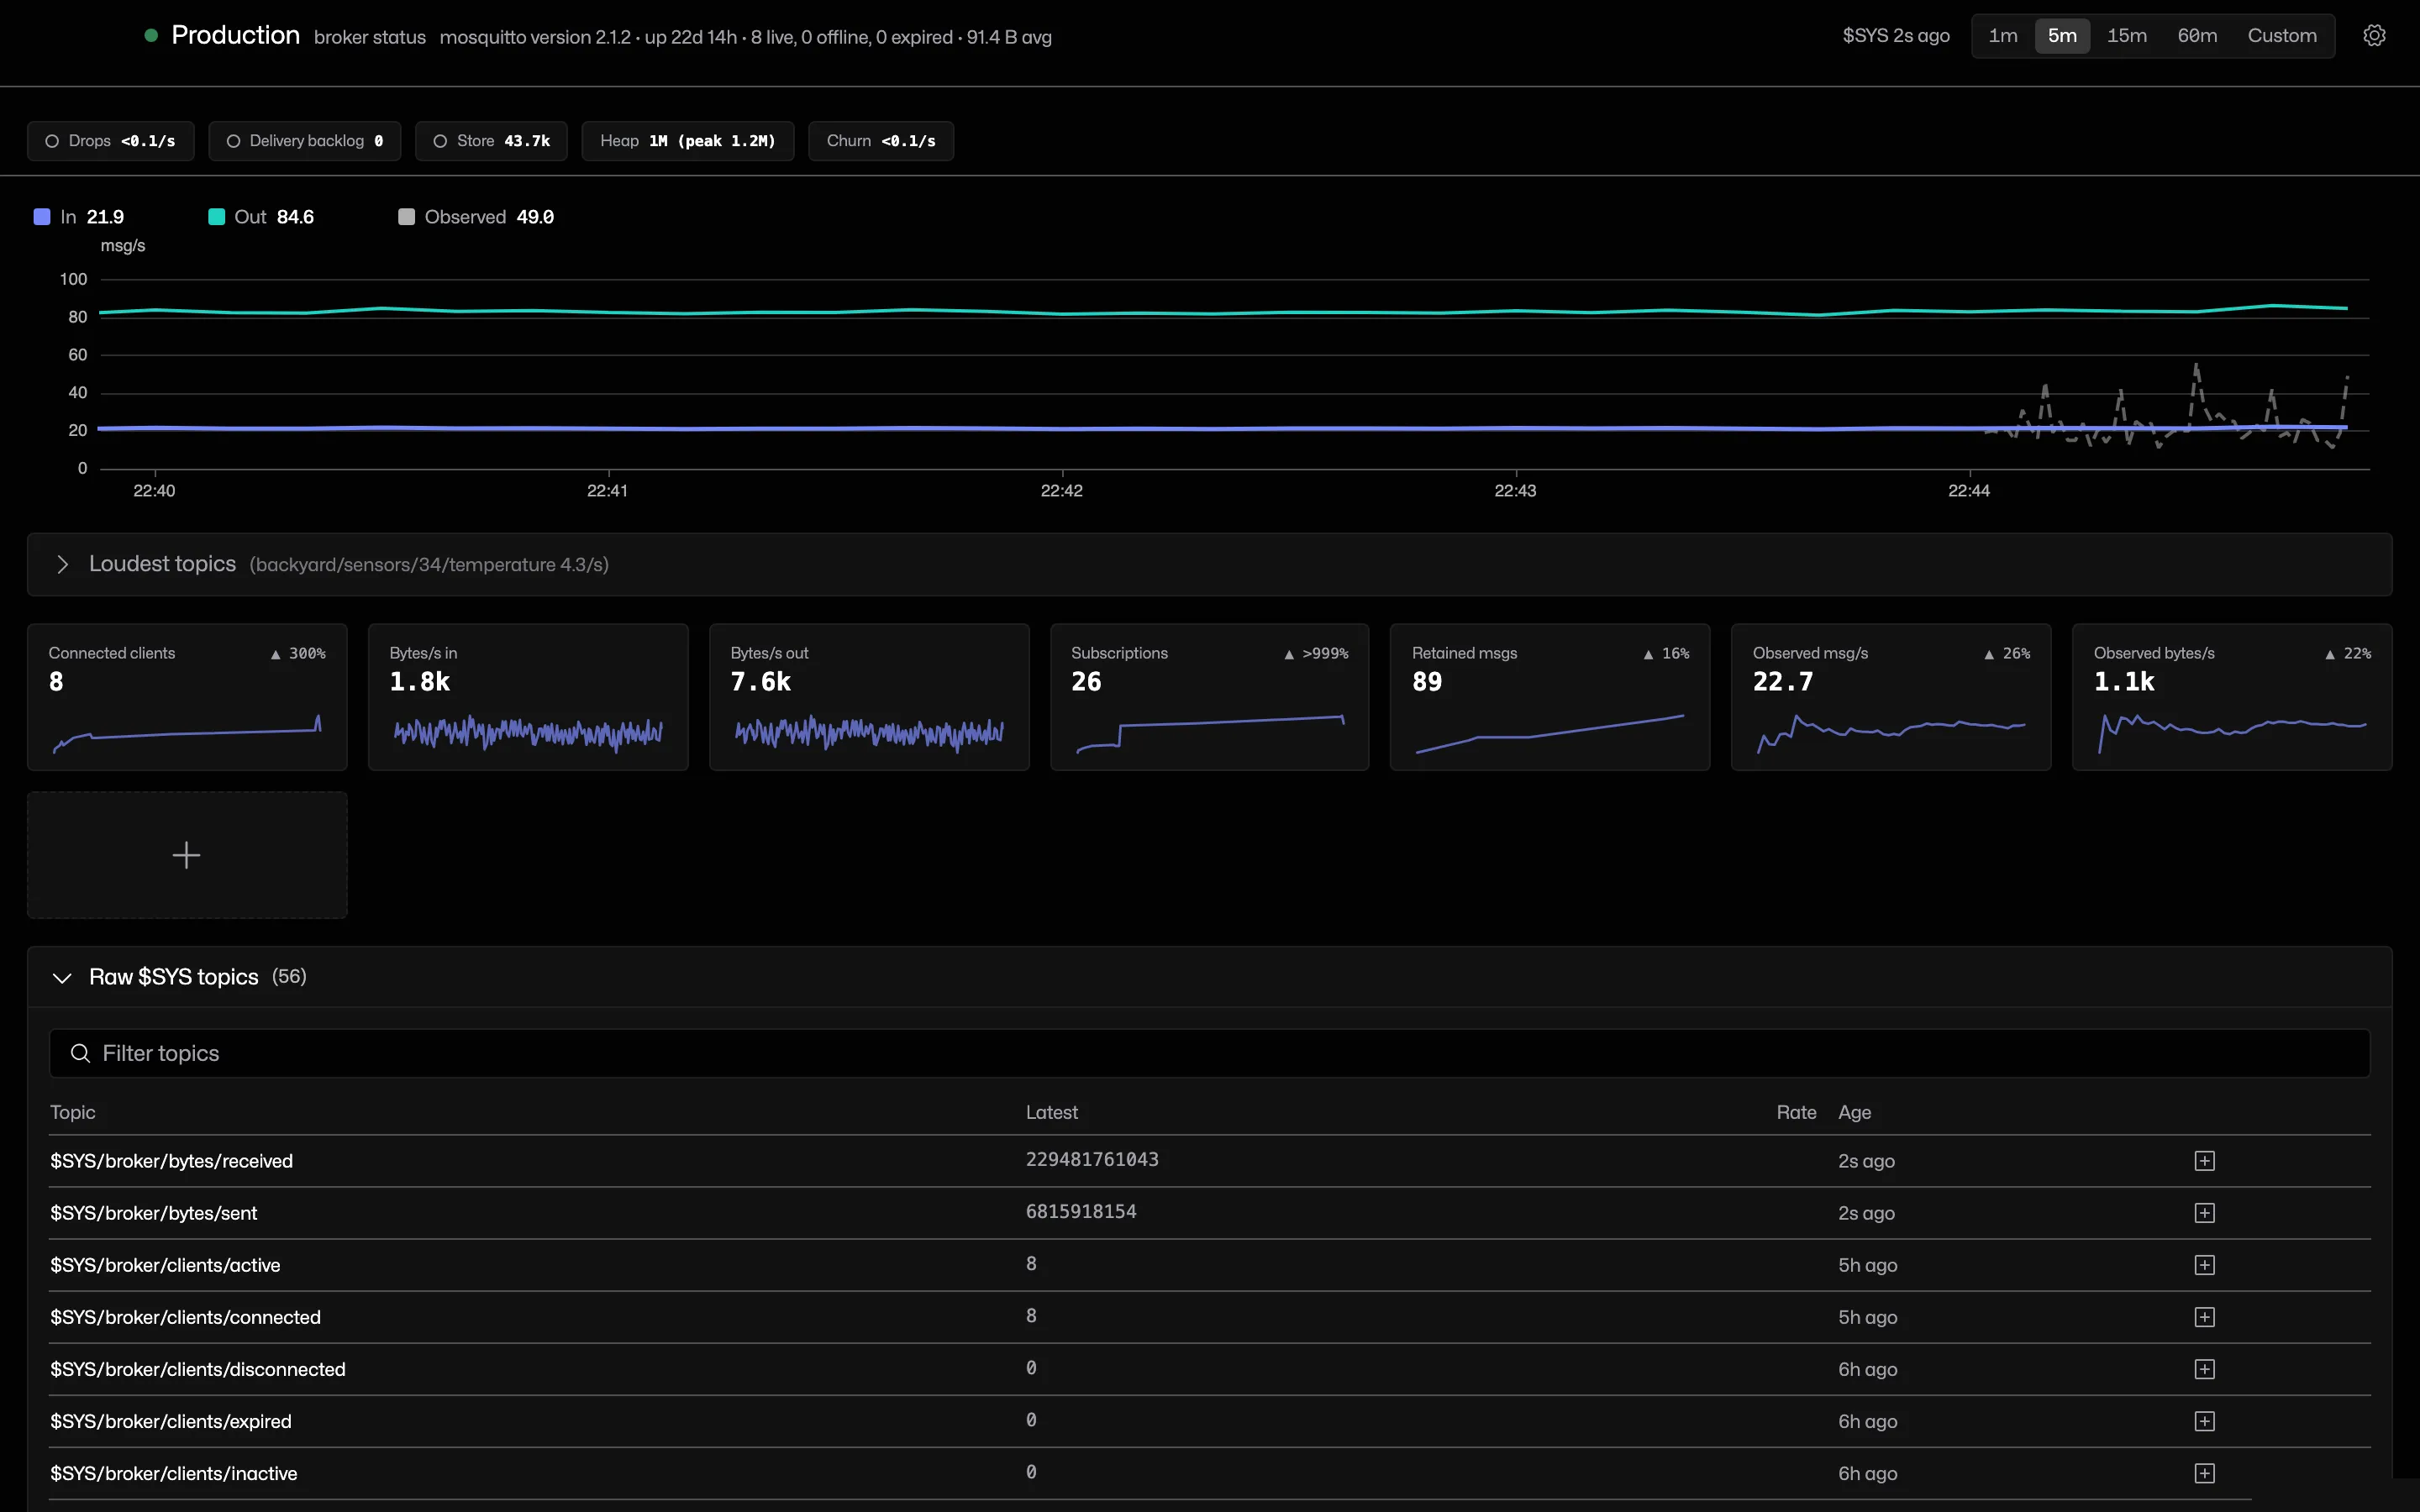
Metric mappings ship for mosquitto, EMQX and VerneMQ. Point any tile at a different topic, or pin any row from the raw $SYS browser as a tile. Tiles are saved per connection.
What each broker publishes is in the $SYS topics reference.
Frequently asked questions
Which brokers does the status page support?
Tiles are mapped for mosquitto, EMQX and VerneMQ. Any broker that publishes $SYS topics can be mapped by hand, and brokers that publish nothing still get client-side message rates and a loudest topics list.
Does the status page need special permissions on the broker?
A subscription to $SYS/#, which new connections include by default. Brokers that restrict $SYS to admin clients show the client-side measurements only.
Related features
MQTT Viewer is free and open source, and runs on macOS, Windows and Linux.
Download MQTT Viewer