Chart MQTT payload values live
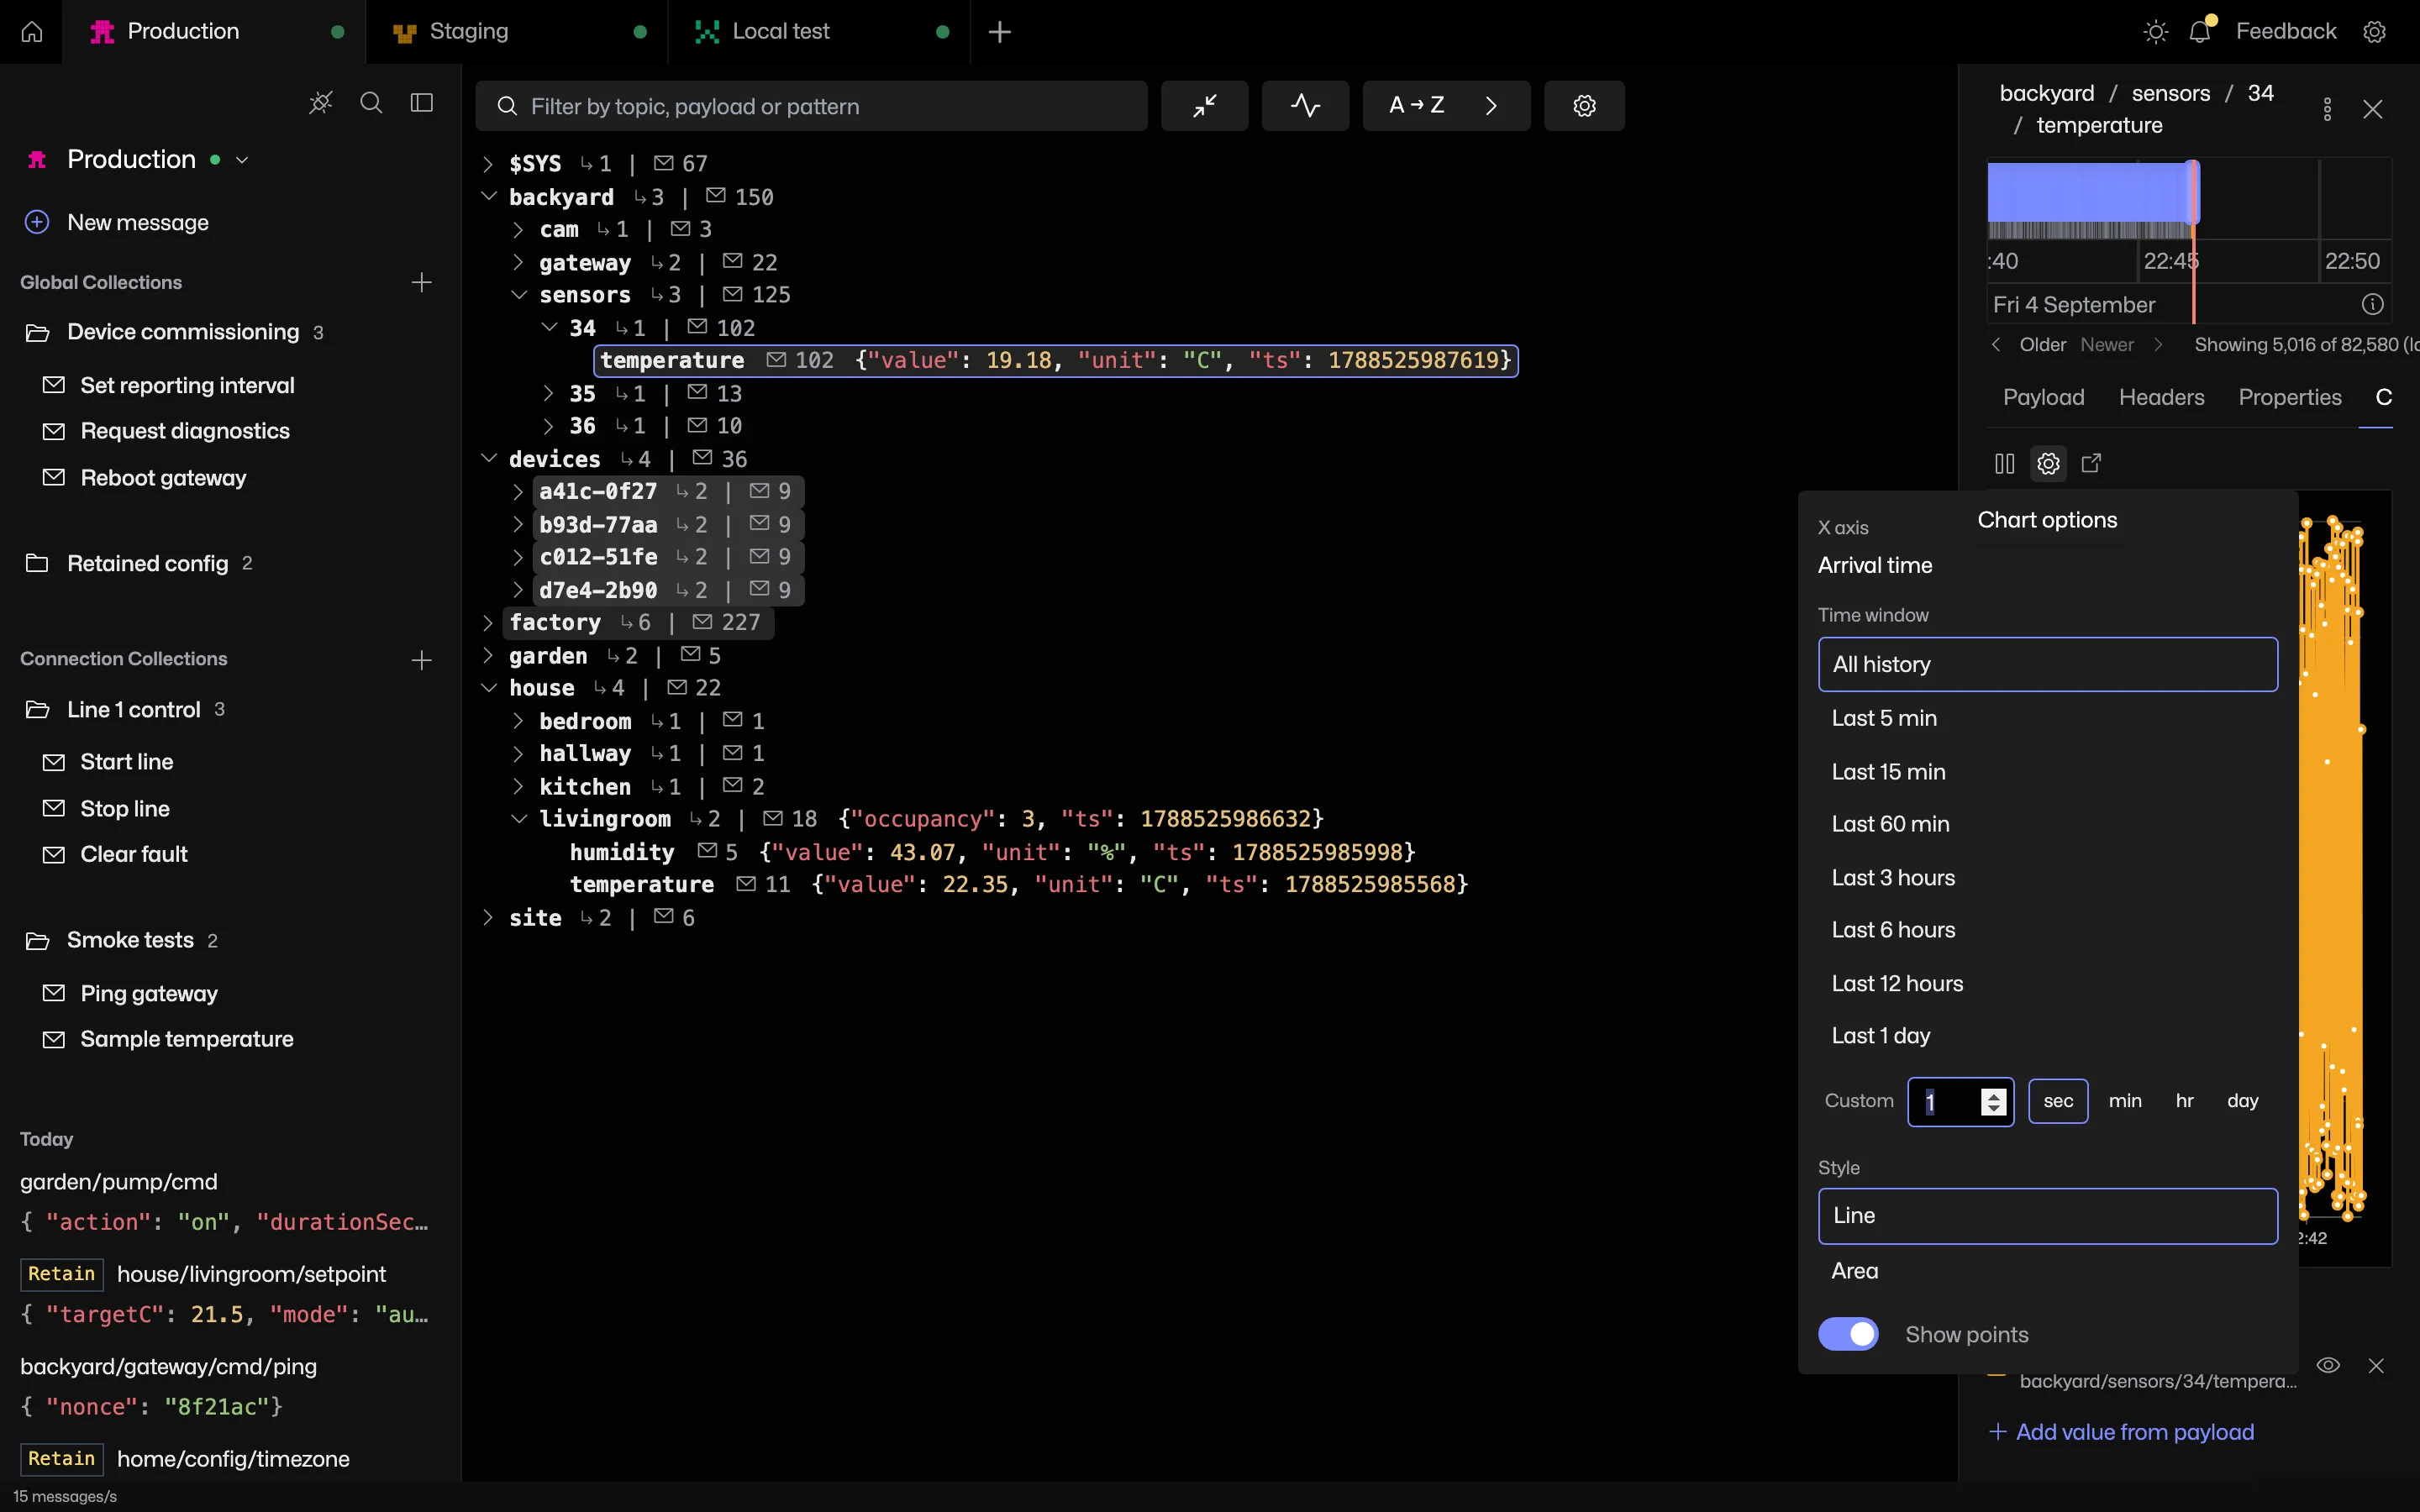
Tick the numeric fields you want in the payload tab and they plot live in the Chart tab.
Try it in MQTT Viewer
What can be charted
- Any numeric field in a JSON payload, nested or not.
- Payloads that are a bare number.
- Numbers sent as strings, such as
"24.6". - Values with a decimal comma, read as decimals rather than thousands.
Series and drawing
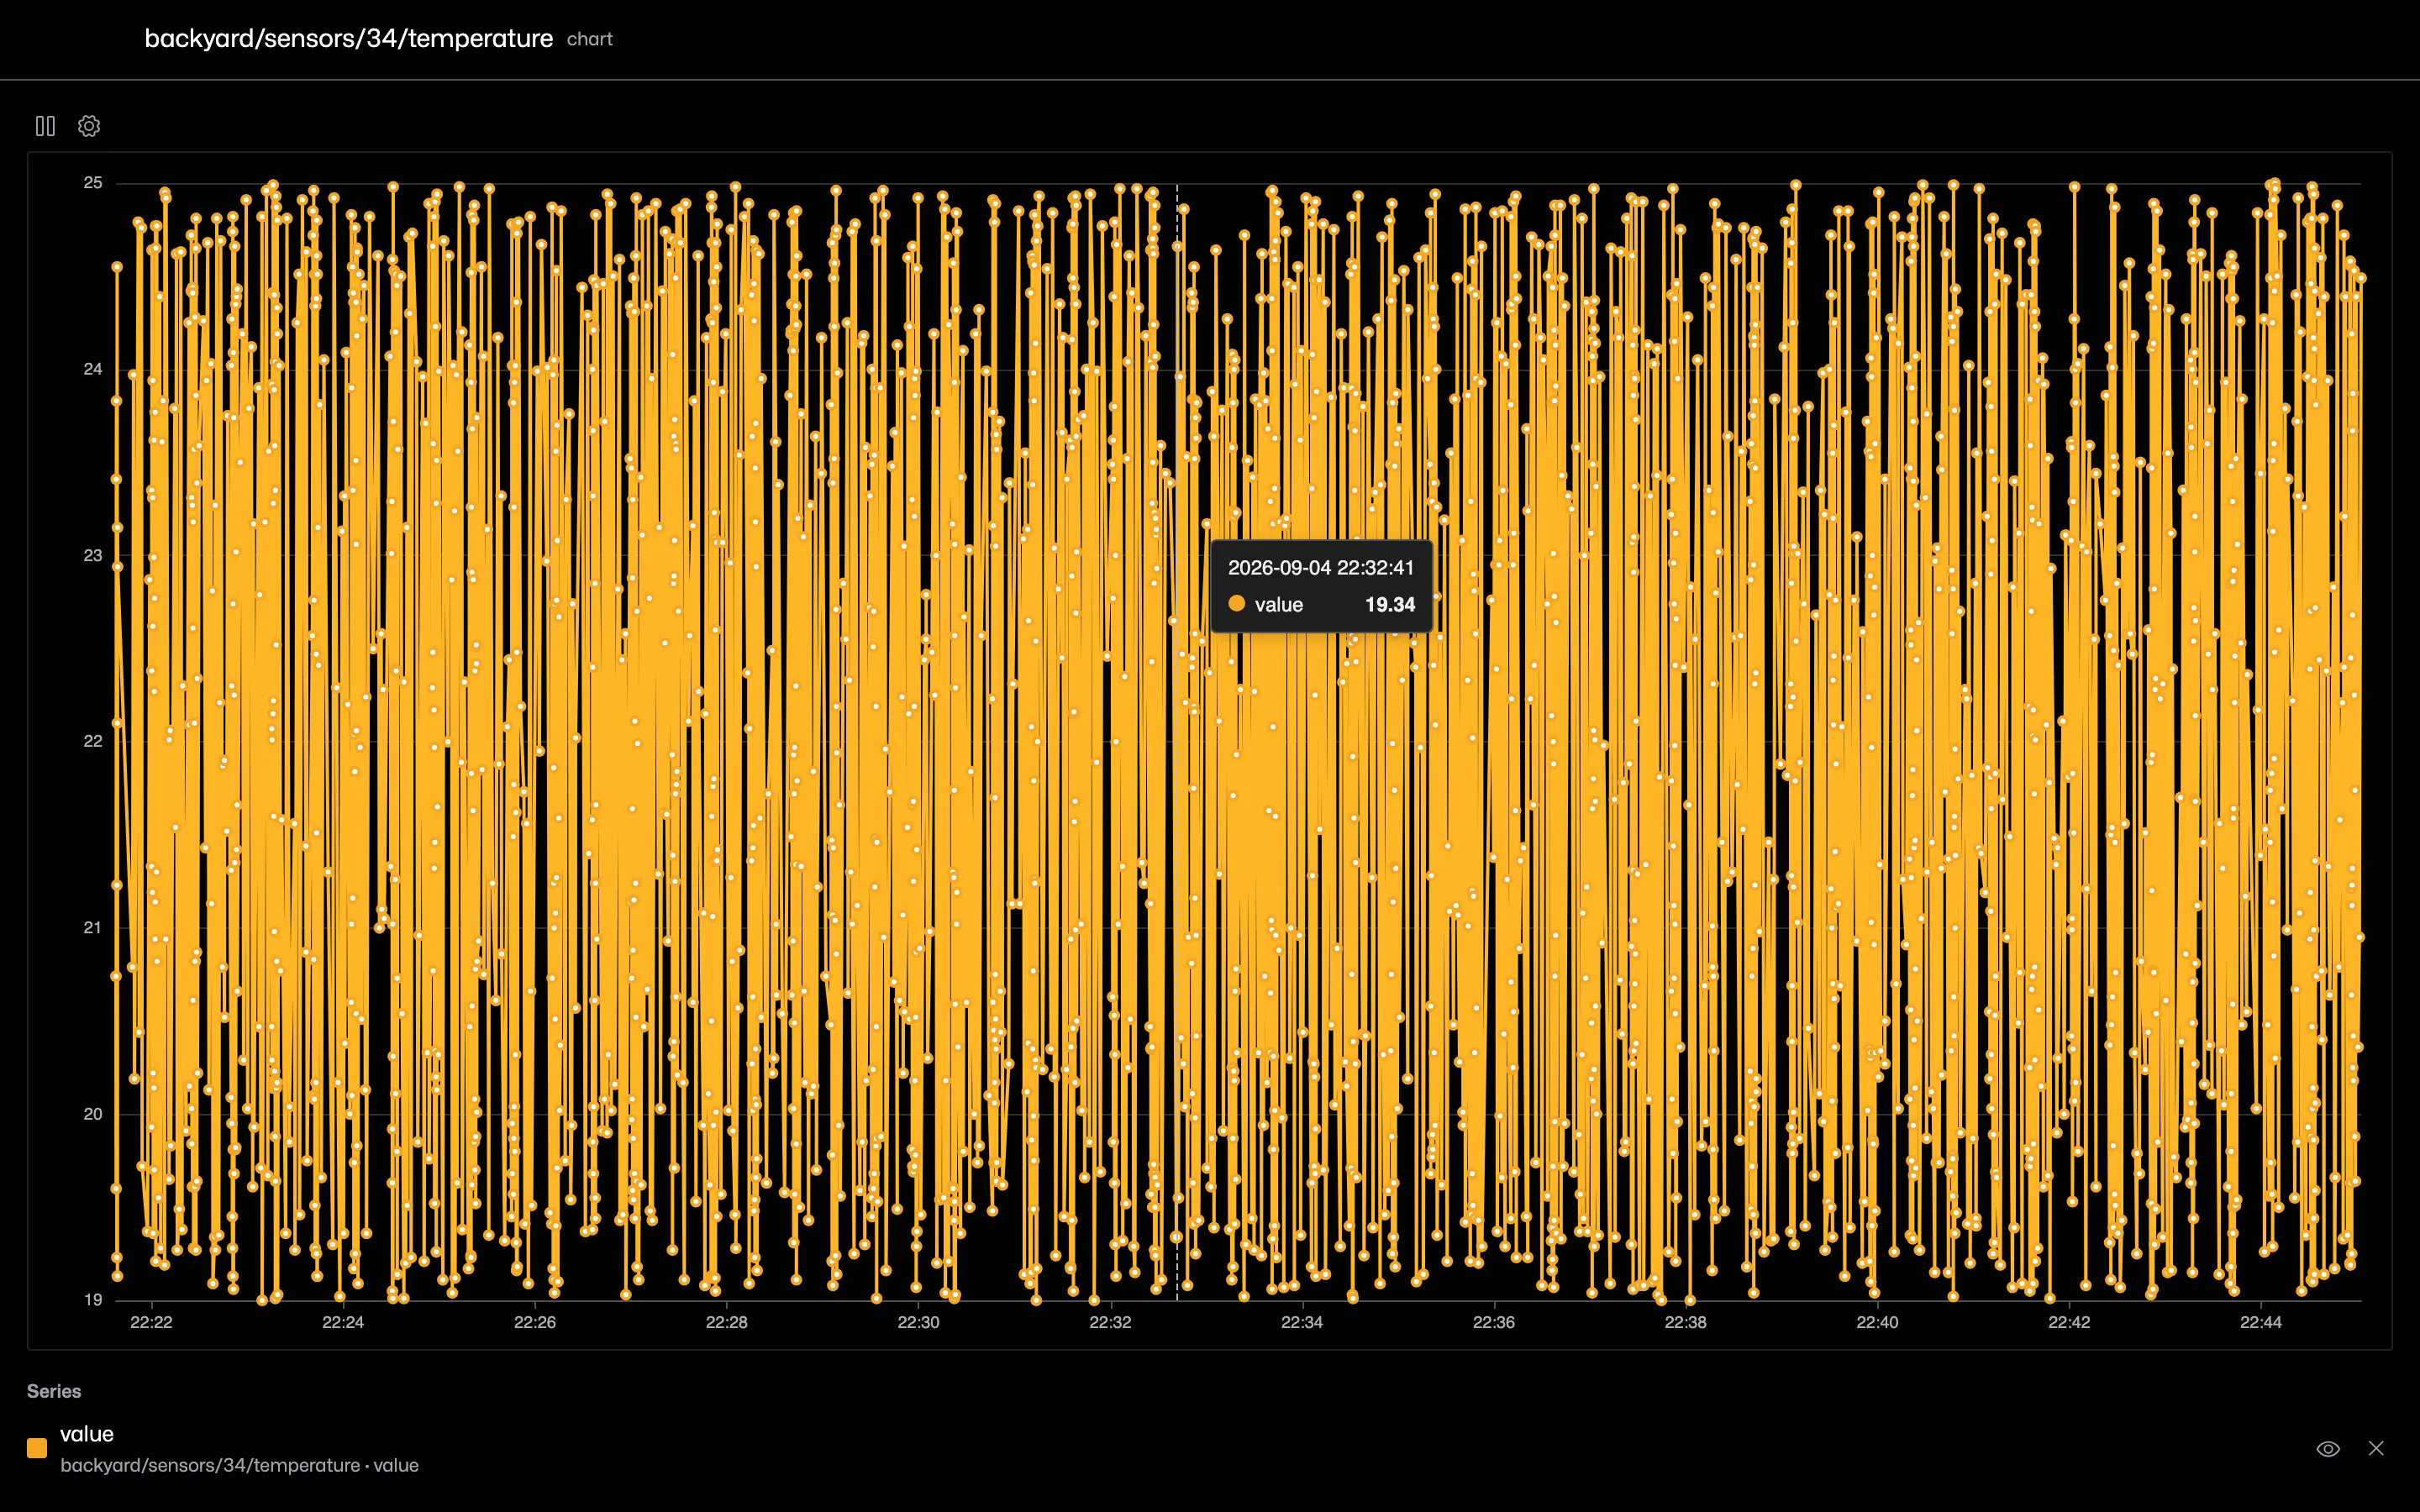
Each series has a colour, a legend entry, a hide toggle and a remove button. Long histories are downsampled for drawing.
Time windows
5, 15 or 60 minutes, 3, 6 or 12 hours, a day, all history, or a custom interval. Pause freezes the chart while messages keep arriving.
Pop-out windows
Send a chart to its own window. Open several to build an ad hoc MQTT dashboard.
Frequently asked questions
Can MQTT Viewer chart values sent as strings?
A field that holds a number in quotes, such as "24.6", charts as a number. Fields that do not parse as numbers are not offered in the picker.
Can MQTT Viewer chart several topics on one graph?
A chart shows one topic with as many of its fields as you tick. To watch several topics, open each in a pop-out chart window.
Related features
MQTT Viewer is free and open source, and runs on macOS, Windows and Linux.
Download MQTT Viewer