Chart values from MQTT messages
Plot numeric fields from a topic’s received payloads.
Before you start
Connect to a broker and subscribe to a topic that publishes numeric data. The chart needs received samples; it cannot invent readings from before the client received them.
1. Open a numeric payload
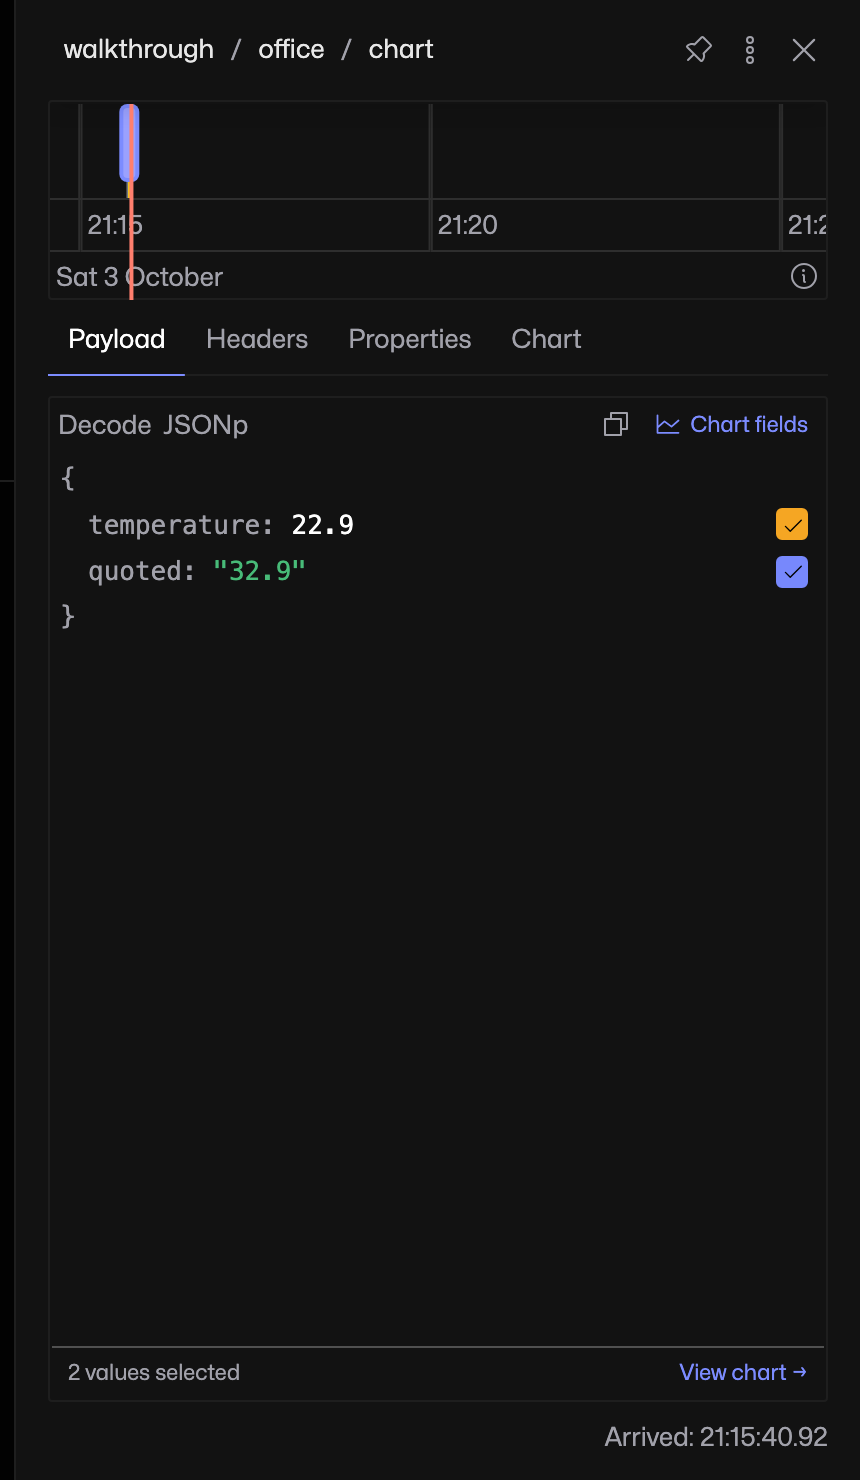
Select a topic carrying JSON numbers. The example publishes a temperature number and a numeric string named quoted. Open its Payload tab.
2. Choose the fields
Click Chart fields, then tick the numeric values you want to plot. Both numbers and quoted numeric values can be selected.
3. Read the chart
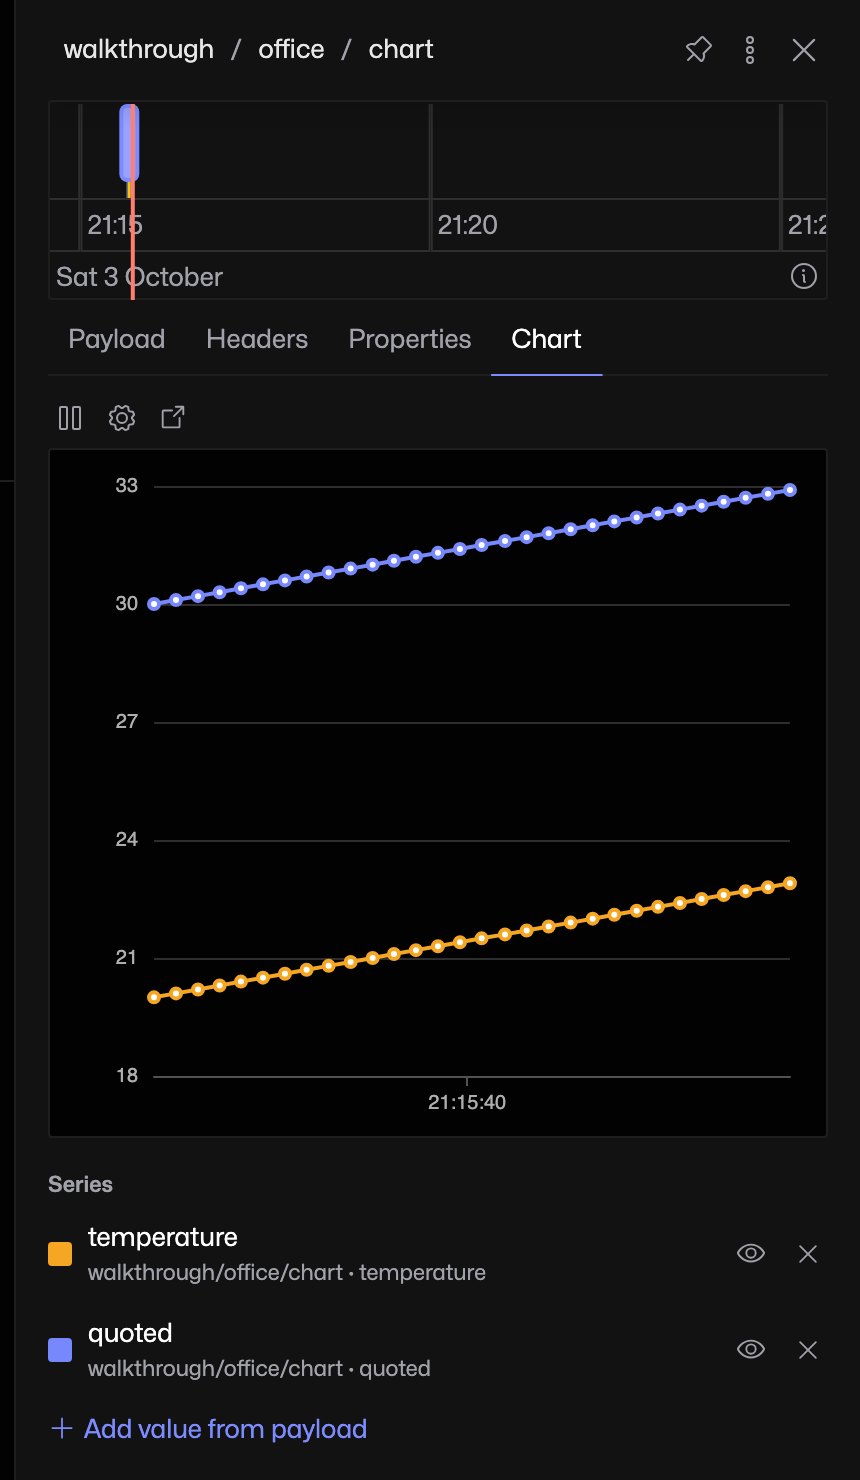
Select Chart. Each selected field appears as a separate series. In this example, 30 received samples rise from 20 to 22.9 and from 30 to 32.9. The series list identifies which line belongs to each field.
If a line is missing
Check the selected field contains a number and that messages are arriving on the same topic. Use Add value from payload to choose another field. The chart only has the history still available to this connection.