MQTT graph of live topic traffic
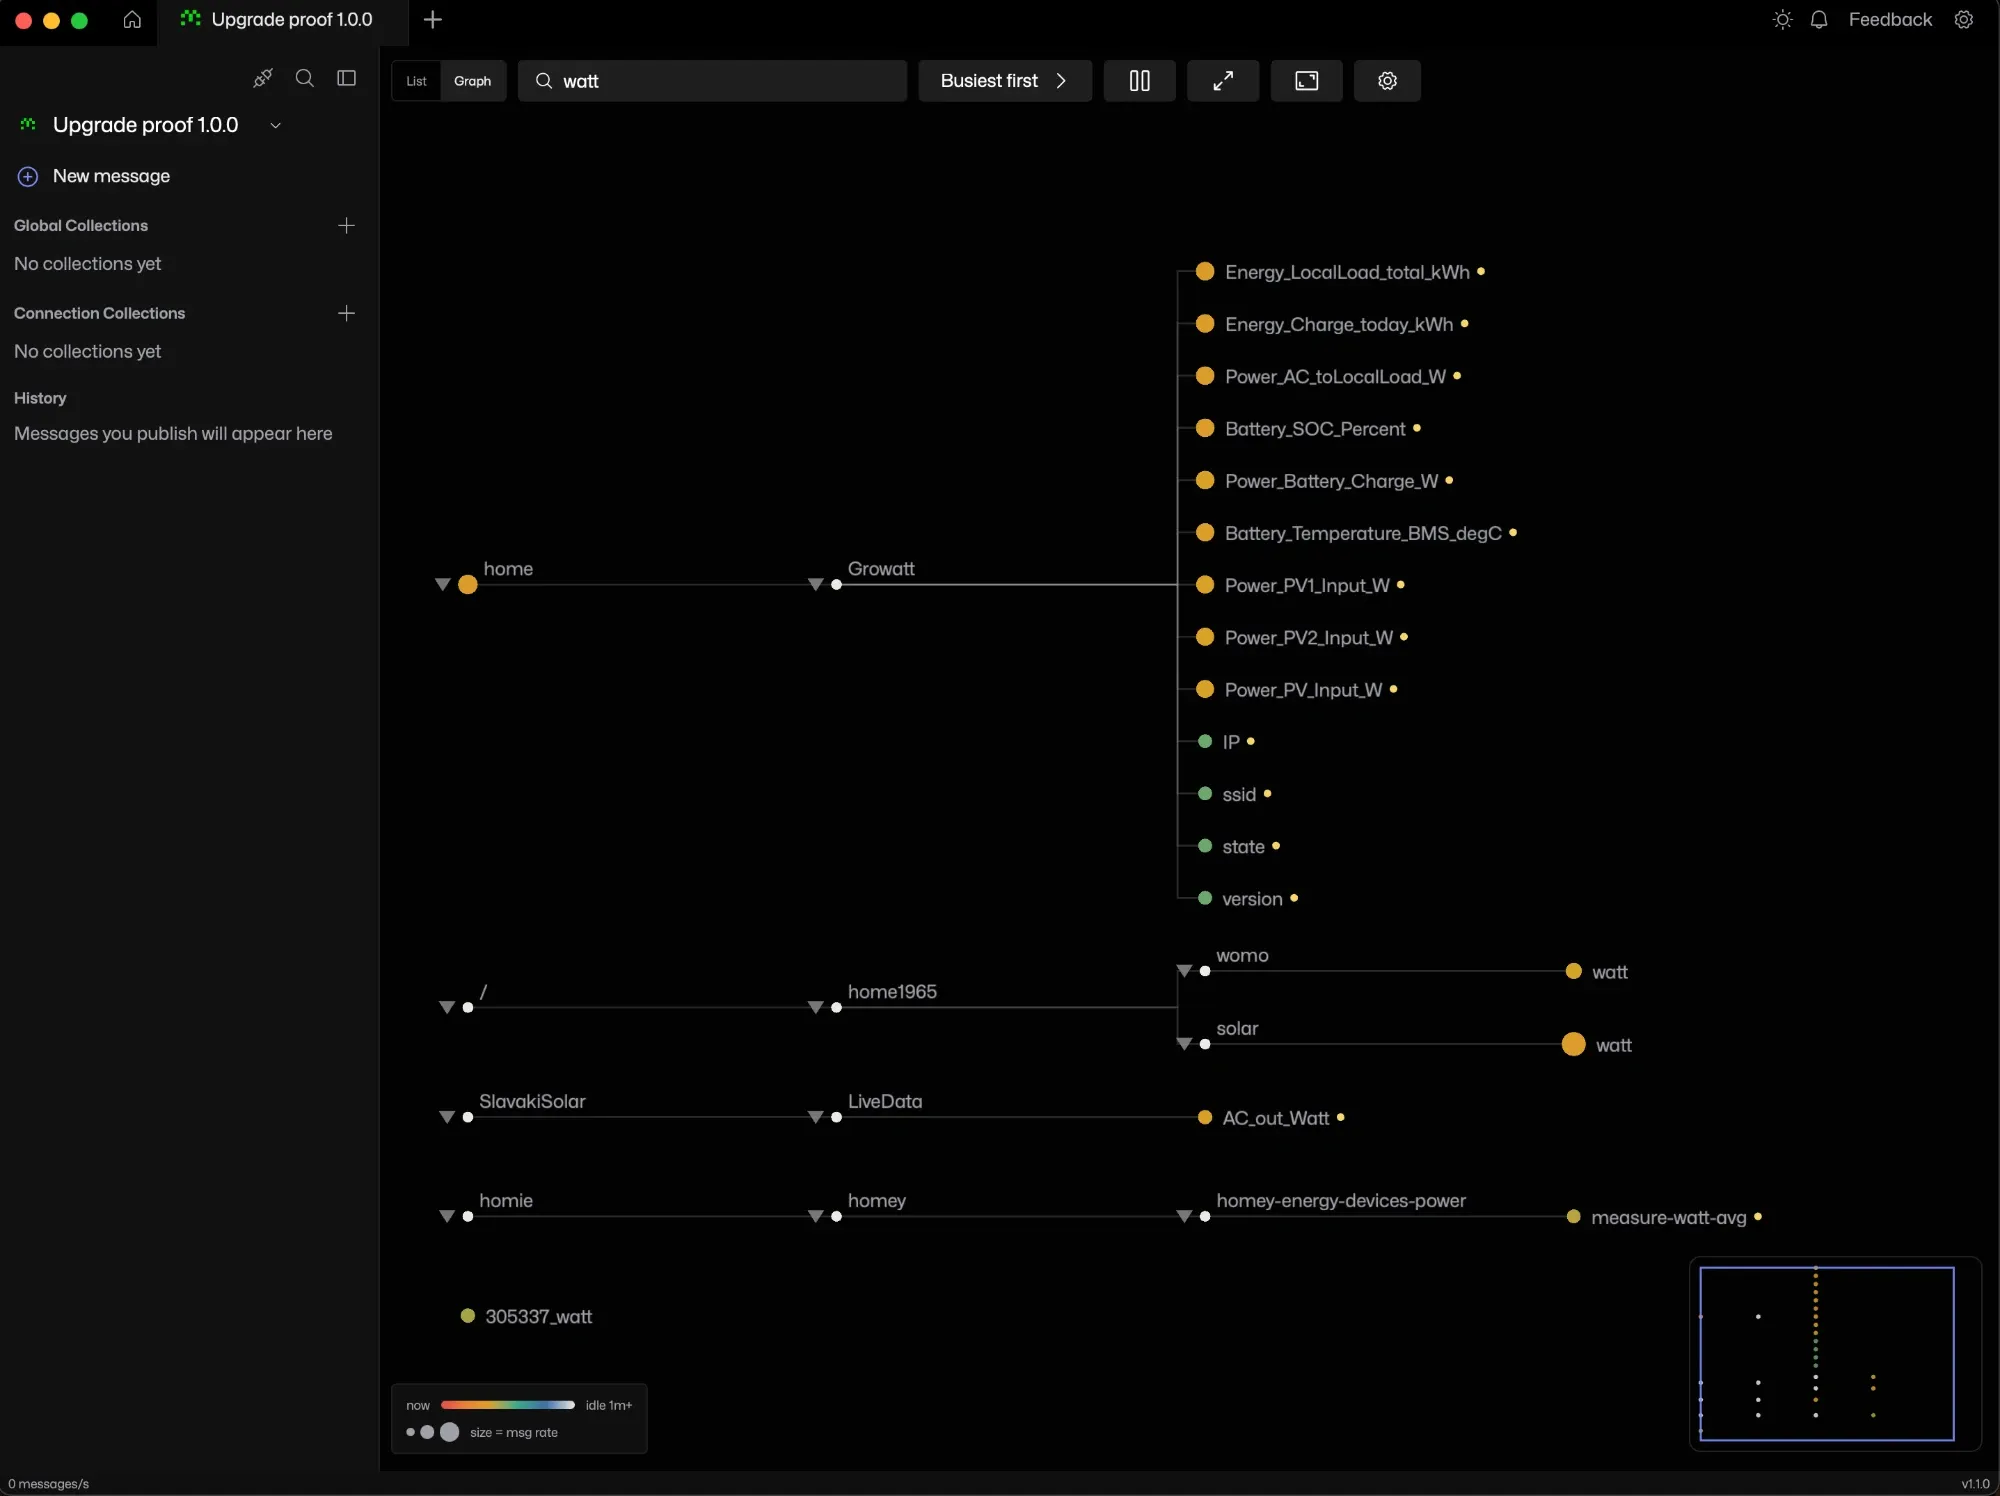
The list shows which topics exist. The graph shows where the traffic is. Each node is sized by its message rate and coloured by how recently it received a message.
Try it in MQTT Viewer
Size and colour
Node size follows a smoothed message rate. Colour shows recency, fading from hot to cold over a window you set. A collapsed parent shows its own traffic plus every descendant: rates add together, while colour follows the most recent message in the branch.
Expand a parent to see its children. The parent then shows only its own traffic, becoming a small junction if nothing publishes directly to it. Follow the larger branches to find the busy topic.
Controls
- Collapse a branch to sum its message rates. Its colour follows the most recent message anywhere below it, and its badge counts hidden descendant topics.
- Follow hottest keeps the view centred on the traffic.
- Pause live re-sorting holds the sibling order while messages and traffic indicators keep updating.
- Pan, zoom, fit to view, or jump around with the minimap.
- Sort children by rate or by name, and narrow the graph with a topic filter.
Works with the panel and the topic menu
Click a collapsed parent to expand it. Click a leaf or an expanded node to open the topic panel. Right-click for the same topic actions as the list.
Recency window, rate smoothing and a colour-blind safe palette are per-connection settings.
Frequently asked questions
What do node size and colour mean in the topic graph?
Size follows message rate and colour follows recency. A collapsed parent sums its own and all descendant rates, with colour set by the most recent message anywhere in the branch. An expanded parent shows only its own traffic.
Related features
MQTT Viewer is free and open source, and runs on macOS, Windows and Linux.
Download MQTT Viewer