Monitor your MQTT broker
Open the broker status window and trace its metrics back to the broker’s $SYS topics.
Before you start
Use the desktop app and connect to a broker that publishes $SYS metrics. These screenshots use Mosquitto. In the connection’s Subscriptions, include $SYS/#; a plain # subscription does not include it. Your broker must permit access to these topics.
1. Open broker status
In List, click the pulse-shaped Broker status button beside the tree controls. It opens a separate window for this connection.

2. Read the broker metrics
Choose 1m, 5m, 15m or 60m at the top. The traffic chart shows broker input and output alongside what this connection observes. The tiles below show clients, subscriptions, retained messages and byte rates.
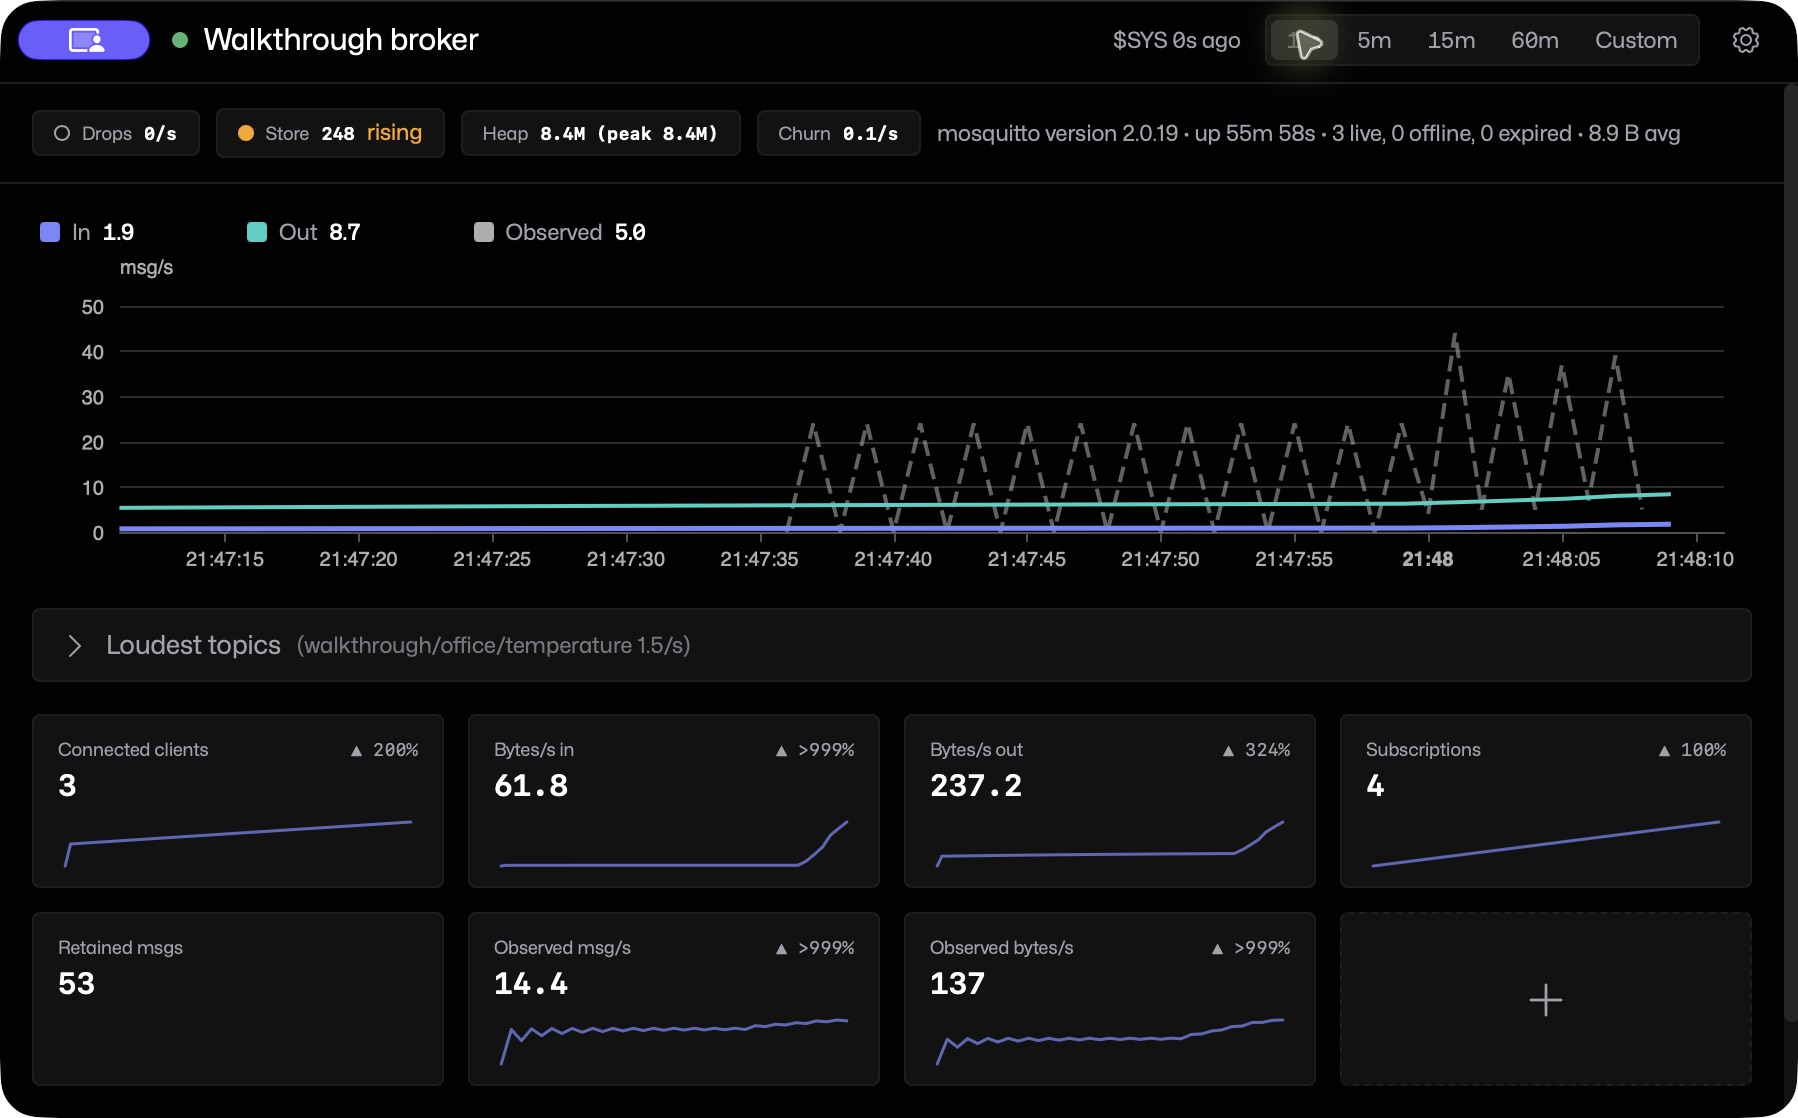
Open Loudest topics to inspect traffic seen by this client. It cannot identify topics excluded by your subscriptions or broker permissions.
3. Check a raw topic
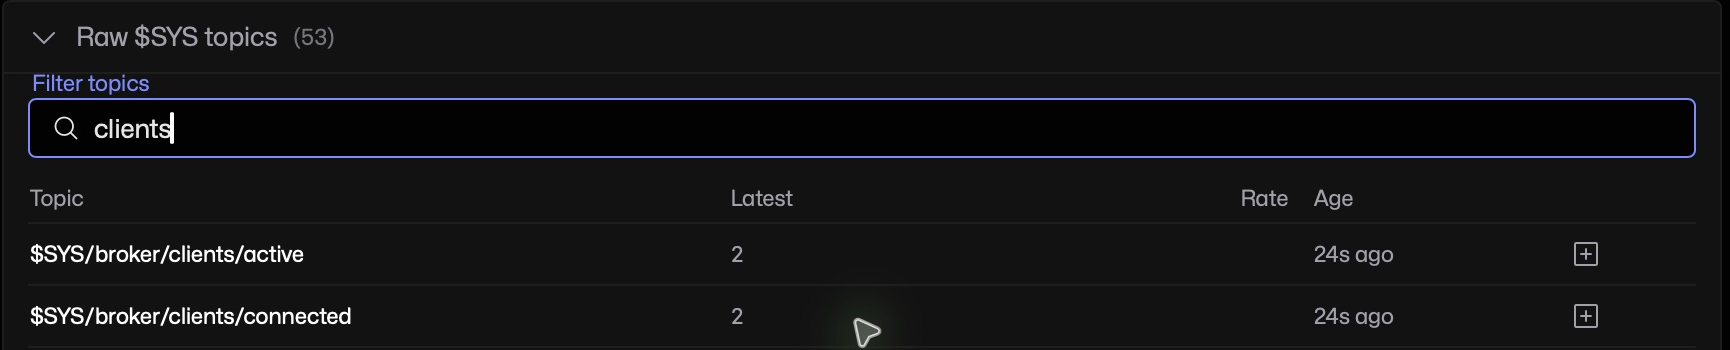
Expand Raw $SYS topics and type clients into Filter topics. Compare $SYS/broker/clients/connected with the Connected clients tile. The raw table shows the latest value and its age.
If broker metrics are missing
Check $SYS/# is subscribed and permitted, then allow time for the broker’s next update. Brokers differ in which metrics they publish. Missing broker metrics do not mean zero traffic. In Docker or Home Assistant, choose Broker status beside List and Graph to open the same metrics in the page.